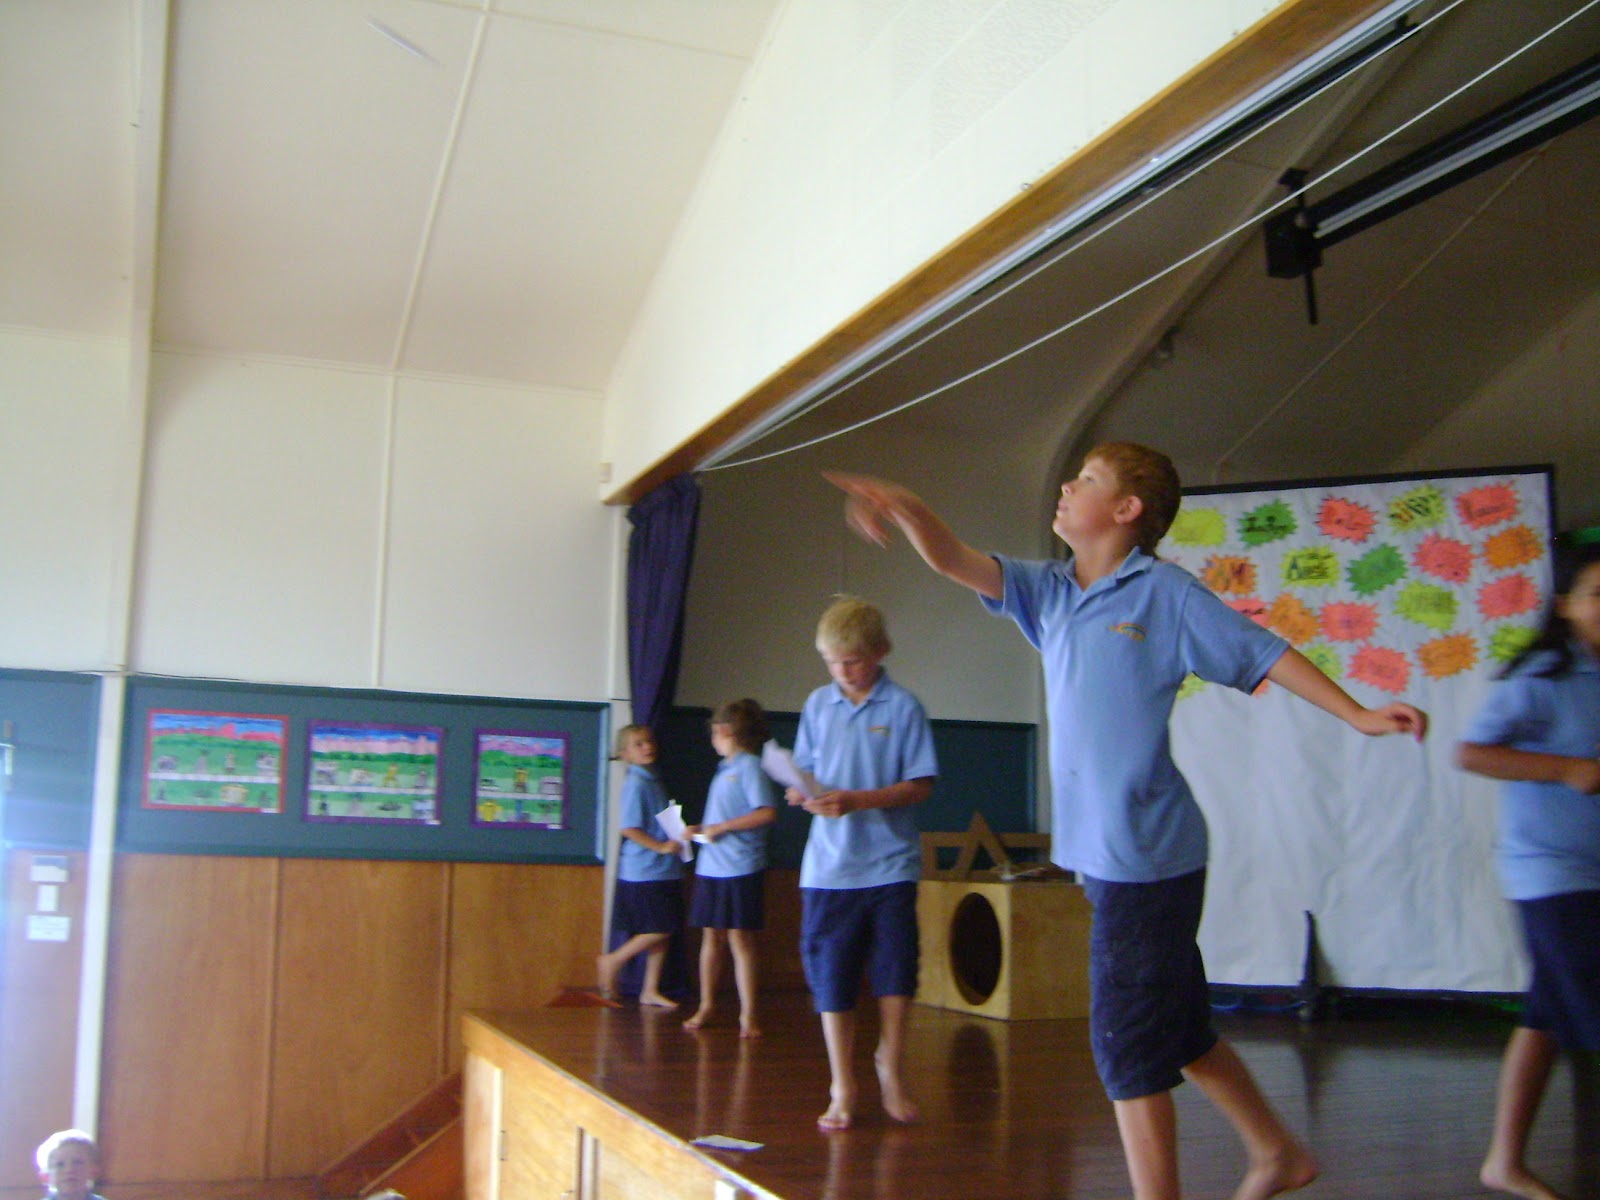
As part of a unit on statistics we got to make paper planes!!! The purpose of this was to collect appropriate data to produce a dot plot graph displaying flying distance against the variable, e.g. distance vs plane size. For this activity we also got to use decimals, such as plane 1 flew 6.4m.
In another fun statistics lesson we measured our resting pulse and after exercise pulse, put them on a stem and leaf graph and worked out the mean, median, mode and range. We also had discussion about the science behind it and how an athletes pulse would perform.




 This is a machine that evapourates the moisture from food and we used apples!! They were delicious!!!


